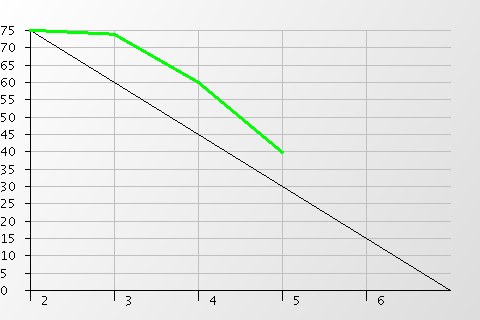
and burnup charts like this
This page can be used to generate burndown chart like this
and burnup charts like this
Copy the image URL to see how the charts are generated. All the information to draw the chart is in the image URL.
To get the resulting chart embedded into a MediaWiki page, make sure that embedded display of external images is enabled on your MediaWiki installation and that the URL ends in .png. For example like this. Note that the generator currently ignores the format parameter (it always generates a PNG). The format parameter is just needed to make sure the URL ends with .png.
You can read more about this generator and burndown charts in general here.
| # | colors | sample |
|---|---|---|
| 0 |
00ff00
00f0f0
e00000
dddddd
|
|
| 1 |
ff5f00
ef002a
f76f87
ffc973
|
|
| 2 |
086fa1
ffb800
ff3500
63add0
|
|
| Date | Change |
|---|---|
| 20121221 | You can now specify a "max_work" parameter to override the auto-scaling done normally. If you specify "max_work" the chart will be as high as the number you specify and the ideal burndown will start from that number. As requested by gin. |
| 20100101 |
Introduced color schemes, up to four work lines, background gradients and control over size of the generated image. If you don't want an ideal burndown line, you can get skip it by passing ideal=0. This is useful for drawing burnup charts. |
| 20070926 | You can now specify a second work parameter with its own set of values. This is useful for doing burndown comparisions, like in a release planning. |
| 20070902 | Now correctly calculates the maximum work, instead of assuming the first work value is the highest. |
| 20070830 | The line is now drawn smoother and wider, making the chart look nicer. |