<%@ page import="java.io.*" %>
<%@ page import="java.awt.*"
%><%@ page import="java.awt.image.*"
%><%@ page import="java.io.*"
%><%@ page import="javax.swing.*"
%><%@ page import="javax.imageio.*"
%><%@ page import="com.sun.image.codec.jpeg.*"
%><%!
// A simple chart class, allowing drawing in a more convenient coordinate system
private static class Chart {
public Graphics2D g;
int left, top, right, bottom, width, height;
float scale_x, scale_y;
public Chart(Graphics2D g, int left, int top, int right, int bottom, float scale_x, float scale_y) {
this.g = g;
this.left = left; this.top = top; this.right = right; this.bottom = bottom;
this.scale_x = scale_x; this.scale_y = scale_y;
this.width = this.right - this.left + 1;
this.height = this.bottom - this.top + 1;
}
public void drawLine(int x1, int y1, int x2, int y2) {
g.drawLine( left + (int)(x1 * scale_x), bottom - (int)(y1 * scale_y),
left + (int)(x2 * scale_x), bottom - (int)(y2 * scale_y) );
}
}
Throwable e = null;
public static final Color[] ORIGINAL = new Color[] {
new Color(0xCC00FF00), new Color(0xCC00F0F0), new Color(0xCCE00000), new Color(0xCCDDDDDD)
};
public static final Color[] ORANGE = new Color[] {
new Color(0xCCFF5F00), new Color(0xCCEF002A), new Color(0xCCF76F87), new Color(0xCCFFC973)
}; // http://colorschemedesigner.com/#0m51Tw0w0w0w0
public static final Color[] BLUE = new Color[] {
new Color(0xCC086FA1), new Color(0xCCFFB800), new Color(0xCCFF3500), new Color(0xCC63ADD0)
}; // http://colorschemedesigner.com/#3s31Tw0w0w0w0
public static final Color[][] COLOR_SCHEMES = new Color[][] {ORIGINAL, ORANGE, BLUE};
public static int getIntParameter(HttpServletRequest request, String key, int defaultValue) {
if (request.getParameterMap().containsKey(key)) {
return Integer.parseInt(request.getParameter(key));
}
return defaultValue;
}
public static String toCss(Color c) {
String result = Integer.toHexString(c.getRGB() & 0x00FFFFFF);
while (result.length() < 6) result = "0" + result;
return result;
}
%><%if (request.getParameterMap().containsKey("days")) {
try {
String[] days = request.getParameter("days").split(",");
int[][] work = new int[request.getParameterValues("work").length][];
for (int i=0; i < request.getParameterValues("work").length; i++) {
String[] workStrings = request.getParameterValues("work")[i].split(",");
work[i] = new int[workStrings.length];
for (int j=0; j < workStrings.length; j++) {
work[i][j] = Integer.parseInt(workStrings[j]);
}
}
int width = getIntParameter(request, "width", 480);
int height = getIntParameter(request, "height", 320);
int border = getIntParameter(request, "border", 30);
Color[] colors = COLOR_SCHEMES[getIntParameter(request, "colors", 0)];
int chart_width = width - 2*border;
int chart_height = height - 2*border;
int chart_top = border;
int chart_left = border;
int chart_right = width - border;
int chart_bottom = height - border;
float day_width = (float)chart_width / days.length;
int max_work = work[0][0];
for (int i=1; i < work[0].length; i++) {
if (work[0][i] > max_work) {
max_work = work[0][i];
}
}
max_work = getIntParameter(request, "max_work", max_work);
float hour_height = (float)chart_height / max_work;
Color background = Color.WHITE;
// prepare some output
BufferedImage buffer = new BufferedImage(width,height,BufferedImage.TYPE_INT_RGB);
Graphics2D g = buffer.createGraphics();
g.setPaint(new GradientPaint(0,0,Color.WHITE, width, height, colors[3]));
g.fillRect(0,0,width,height);
Chart c = new Chart(g, chart_left, chart_top, chart_right, chart_bottom, day_width, hour_height);
// draw day numbers, ticks and grid lines
for (int i=0; i < days.length; i++) {
int x = chart_left + Math.round(i*day_width);
g.setColor(Color.BLACK);
c.drawLine(i, 0, i, -3);
g.drawString(""+days[i], x + Math.round(day_width/8), chart_bottom + 15);
g.setColor(Color.LIGHT_GRAY);
if (i > 0) {
//g.drawLine(x, chart_top, x, chart_bottom-1);
c.drawLine(i, 0, i, max_work);
}
}
// draw hour numbers, ticks and grid lines
int marker_distance = Math.round(30 / hour_height / 10)*10;
if (marker_distance > 1000) {
marker_distance = Math.round(marker_distance/1000)*1000;
} else if (marker_distance > 100) {
marker_distance = Math.round(marker_distance/100)*100;
} else if (marker_distance > 10) {
marker_distance = Math.round(marker_distance/10)*10;
} else {
marker_distance = 5;
}
for (int i=0; i <= max_work; i += marker_distance) {
int y = chart_bottom - Math.round(i*hour_height);
g.setColor(Color.BLACK);
g.drawLine(chart_left-5, y, chart_left, y);
String value = i>10000000 ? Math.round(i/1000000)+"m" : i>10000 ? Math.round(i/1000)+"k" : i+"";
g.drawString(value, 0, y + 5);
g.setColor(Color.LIGHT_GRAY);
if (i > 0) {
g.drawLine(chart_left+1, y, chart_right, y);
}
}
// draw axes
g.setColor(Color.BLACK);
c.drawLine(0, max_work, 0, 0);
c.drawLine(0, 0, days.length, 0);
// draw ideal burndown
if ((!request.getParameterMap().containsKey("ideal")) || !request.getParameter("ideal").equals("0")) {
g.setColor(Color.BLACK);
// if the input specifies a max_work, start ideal burndown from there - otherwise start from first work
c.drawLine(0, getIntParameter(request, "max_work", work[0][0]), days.length, 0);
}
// draw the actual burndown lines back to front
for (int i=work.length-1; i >= 0; i--) {
g.setColor(colors[i]);
g.setStroke(new BasicStroke(width>200 ? 3 : 2));
for (int j=1; j < work[i].length; j++) {
c.drawLine(j-1, work[i][j-1], j, work[i][j]);
}
}
// set the content type and get the output stream
response.setContentType("image/png");
OutputStream os = response.getOutputStream();
// output the image as png
ImageIO.write(buffer, "png", os);
os.close();
} catch (Exception ex) {
e = ex;
}
}
%>
Online burndown chart generator
Online burndown chart generator
Serving burndown charts since 2007
<% if (e != null) { %>
There was a problem processing your request.
<% } %>
This page can be used to generate burndown chart like this
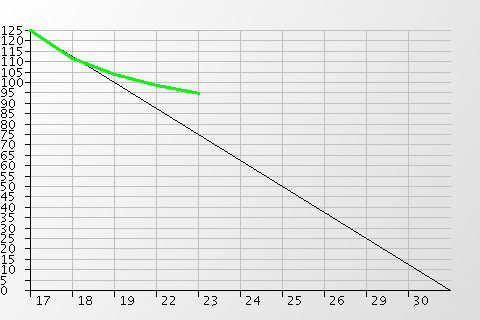
and burnup charts like this
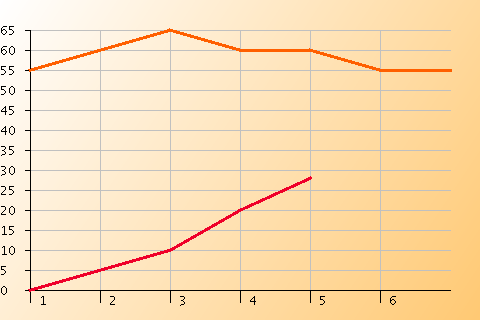
Copy the image URL to see how the charts are generated. All the information to draw the chart is in the image URL.
To get the resulting chart embedded into a MediaWiki page, make sure that embedded display of external images is enabled on your MediaWiki installation and that the URL ends in .png.
For example like this.
Note that the generator currently ignores the format parameter (it always generates a PNG).
The format parameter is just needed to make sure the URL ends with .png.
You can read more about this generator and burndown charts in general here.
| # |
colors |
sample |
<% for (int i=0; i < COLOR_SCHEMES.length; i++) { %>
| <%=i%> |
<% for (int j=0; j < COLOR_SCHEMES[i].length; j++) { %>
<%=toCss(COLOR_SCHEMES[i][j])%>
<% } %>
|
|
<% } %>
| Date |
Change |
| 20121221 |
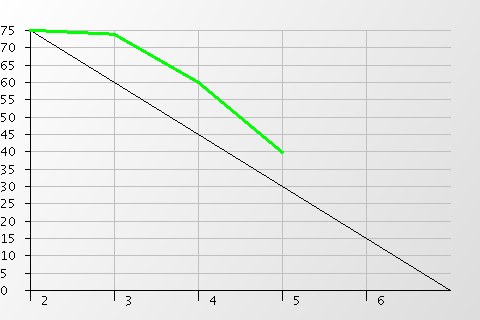
You can now specify a "max_work" parameter to override the auto-scaling done normally. If you specify "max_work" the chart will
be as high as the number you specify and the ideal burndown will start from that number. As requested by gin.
|
| 20100101 |
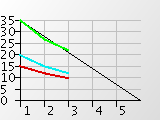
Introduced color schemes, up to four work lines, background gradients and control over size of the generated image.
If you don't want an ideal burndown line, you can get skip it by passing ideal=0. This is useful for drawing burnup charts.
|
| 20070926 |
You can now specify a second work parameter with its own set of values. This is useful for doing burndown comparisions, like in a release planning. |
| 20070902 |
Now correctly calculates the maximum work, instead of assuming the first work value is the highest. |
| 20070830 |
The line is now drawn smoother and wider, making the chart look nicer. |